Guidance only, not an official warning. This is an experimental outlook made by one person. It is not issued by, and has no connection with, the UK Met Office or any official body. For official advice follow the Administration.
What causes the severe winds?
A look at the July 2019 storm in a 1 km weather model.
The short answer. The big storms at the Settlement, such as those of 2001, 2019 and 2026, look like
lee-side downslope windstorms, not tornadoes. Strong south-easterly or easterly air is forced over the island's mountain and
rushes down its north-western side, where the Settlement and Potato Patches are. There it becomes fast, turbulent and very gusty.
The damage can be patchy, and in narrow strips, but the model points to a broad windstorm and not to a single whirl.
Think of a weir, or a boulder in a stream
Picture a river running over a weir, or around a big boulder. Upstream the water is calm and deep. As it goes over the top it
speeds up, and on the downstream face it is a fast, thin, smooth sheet. A little further on the fast water suddenly slows and
churns: a standing wave, foam and eddies. Engineers call this a hydraulic jump. Behind a boulder you get the same thing: fast
water curving over and round, then a boiling, patchy wake.
Air behaves like this when the lower atmosphere is layered, with heavier air near the sea under lighter air above. The layers act
a bit like the water's surface. The strong low-level wind is the river, Tristan's mountain is the boulder, and the Settlement lies in the
wake, just where the fast air lands and turns turbulent.
In the model the mountain is slightly lower than the real peak (1,819 m, against 2,062 m), because a 1 km grid smooths the terrain.
Real winds at the peak can be a bit stronger and the real slopes steeper.
What the 1 km model shows
The plots below are from a 1 km WRF weather model run of the 18–19 July 2019 storm. Winds in this storm blew from the
south-south-east (157°), so the air travels from the left of the cross-sections to the right, towards the north-north-west.
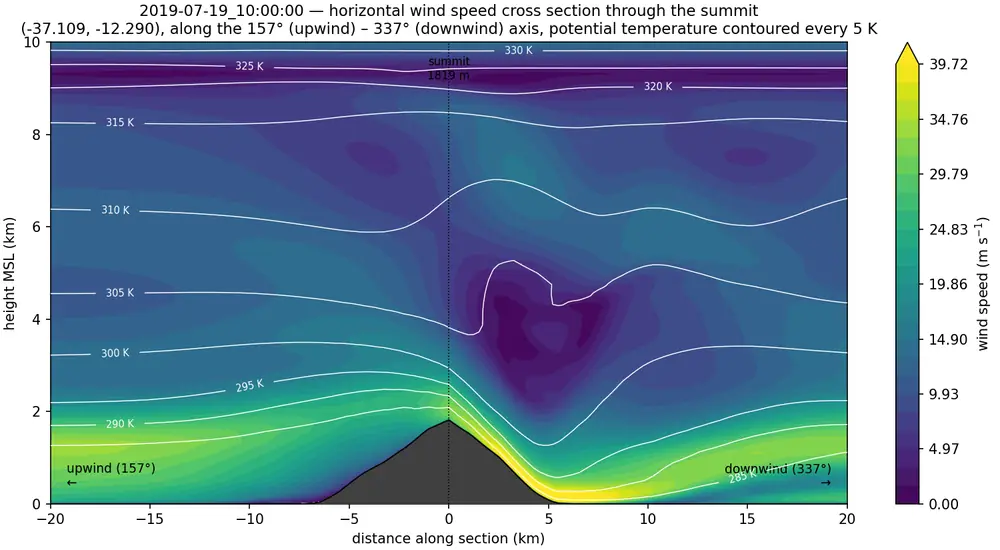
1. A slice through the mountain: wind speed. Colours show wind speed; the white lines are layers of equal warmth, like the
layers of the atmosphere. Upwind (left) the layers are fairly level and there is a fast low-level current of about 30 m/s (110 km/h).
Over the mountain the layers are forced to plunge down the downwind slope and are squeezed together. A narrow stream of air close to
40 m/s (140 km/h) hugs the slope, and a fast layer carries on for another 15–20 km. This is the "fast sheet of water on the
weir's downstream face". Above about 4 km the layers buckle and fold over, and the wind almost stops: a sign of the mountain wave breaking,
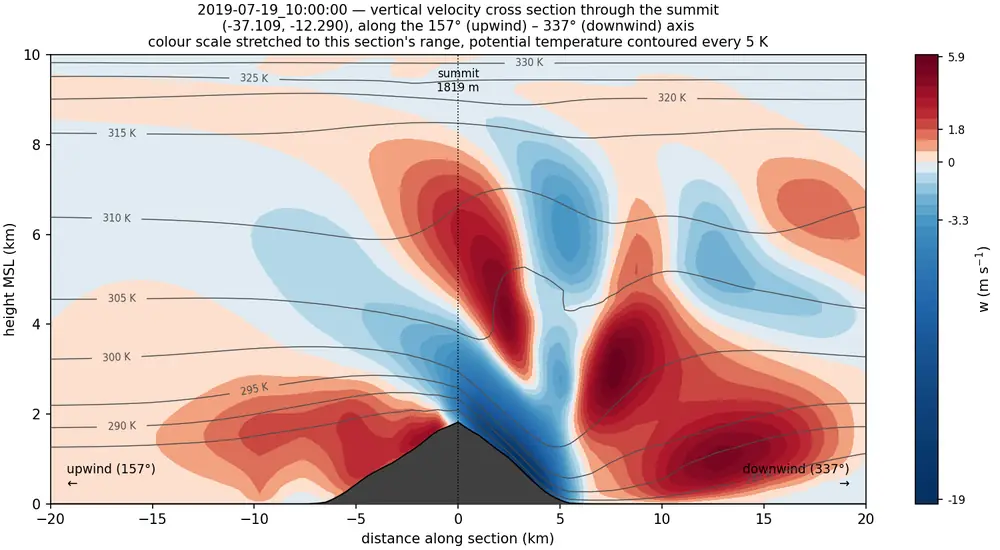
which helps to pull the fast air down.2. The same slice: air going down and up. Blue is sinking air, red is rising air (the colour scale is stretched to this slice). A
narrow, very strong stream of sinking air, up to about 19 m/s, runs down the lee slope. Further downwind, 5 to 15 km out, a broad area of rising
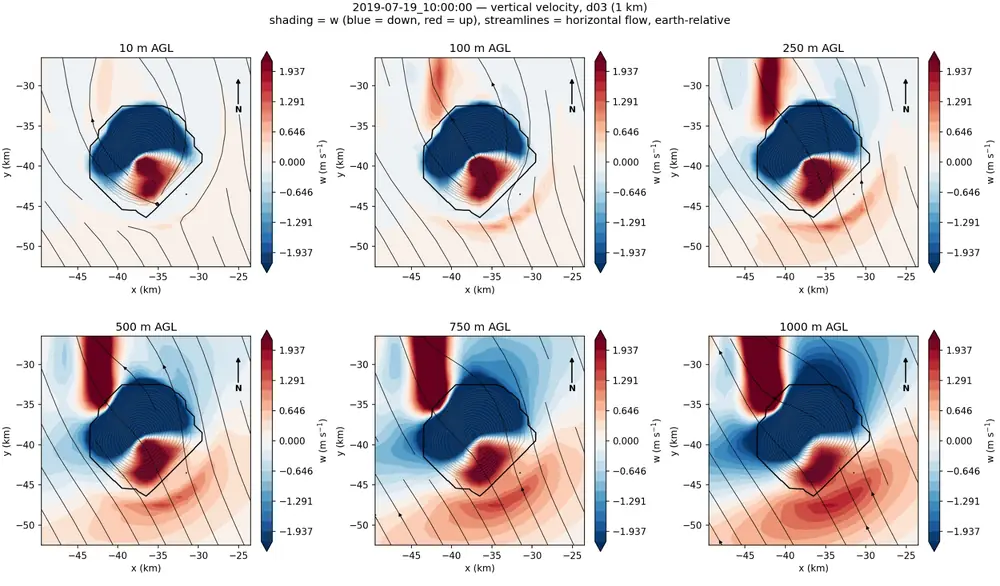
air lifts the fast flow off the ground again: the "jump" in the water analogy. Tilted bands high above are the mountain waves themselves.3. The view from above: air going down and up. North is up and the island is outlined. The six panels run from 10 m to 1,000 m
above the ground. The big blue area is air sinking down the north-western (lee) slopes, where the wind is forced down. Red patches show
air rising where it meets the mountain, to the south, and a strong band of rising air out to the north-west beyond the island, growing stronger with height.
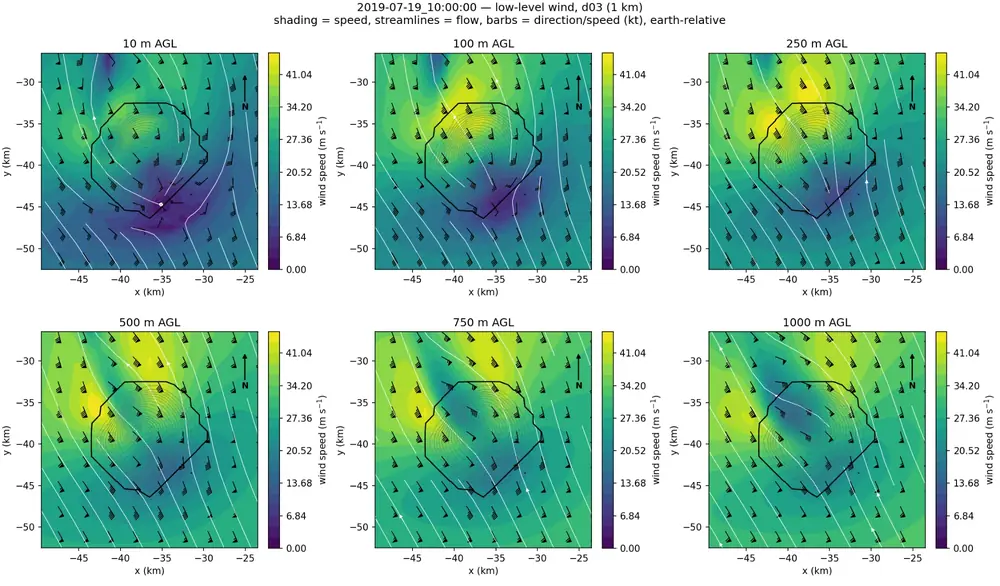
The streamlines curve around the island from the south-south-east.4. Wind speed near the ground. Colours show speed, with arrows and barbs for direction. Between 100 m and 1,000 m the winds are 25 to 40 m/s
(90 to 150 km/h), all from the south-south-east. At 10 m, wind is light on the upwind (south) side, where the air piles up and slows against the
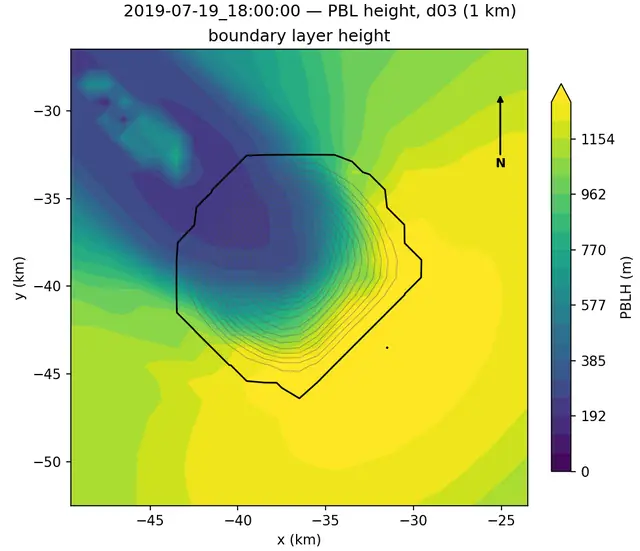
mountain, while strong winds wrap around and speed up on the north-western flank and beyond.5. A thin, fast layer on the lee side. The boundary layer is the churned-up layer next to the ground. Upwind it is deep
(over 1 km, yellow). On the lee side it is squashed to under 400 m (purple): a thin, fast layer pressed against the surface, like the thin sheet of
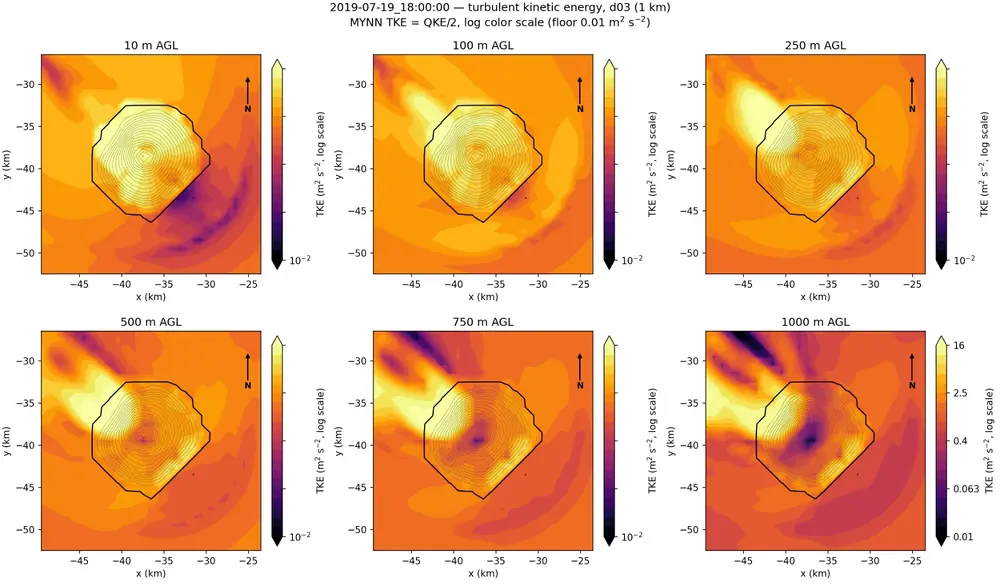
water on a weir.6. Where the turbulence is. Brighter colours mean more turbulence (each step is a big increase). It is strong across the island's slopes and in a plume
streaming away to the north-west, strongest from 250 m to 1,000 m up. This is the churning zone. Gusts arrive in bursts as patches of turbulence pass over, and a
gust can be much stronger than the average wind.
What this means on the ground
Why the Settlement and Potato Patches. They sit in the lee of the peak, on the north-western side, so strong south-easterly or
easterly winds reach them as a fast downslope flow with a turbulent, gusty wake.
Why it is patchy. Turbulence is uneven. Gusts come in short bursts and swirls inside the flow can damage a narrow strip of buildings
and leave the next street alone. Where the wake lands also shifts with the wind direction and strength, which is why different parts of the Settlement
and the Patches are exposed in different storms.
Why it needs a certain set-up. The wind has to be strong and low-level, from the east to south, with lighter air above it. That is what the
outlook looks for. How it is calculated.
What about mini-tornadoes?
Some islanders have wondered whether mini-tornadoes are hitting the Settlement, because damage can flatten one building and spare the next. Turbulence in a
downslope windstorm can do exactly that, and nothing in the model needs a tornado to explain it. The wind field looks like a wide windstorm.
Two honest limits, though:
A 1 km model cannot show small swirls a few tens of metres across. It shows the setting in which they form, not individual whirls, so it cannot prove what
happened to a particular building.
Real twisters and waterspouts can and do occur with showers and thunderstorms, and one was reported at the Potato Patches in August 2015.
That is a different kind of event from the big lee-side storms.
If you saw damage that looked like a narrow tornado track, please report it, with the time and place and what you saw. It helps to separate the two.
About this model run
One case, one model run: a WRF simulation at 1 km grid spacing (the innermost nest, "d03") of the 18–19 July 2019 storm. The plots are valid at 10:00
and 18:00 on 19 July (model time). A single run cannot prove the mechanism, but the picture matches what is seen in lee-side windstorms elsewhere in the world:
fast low-level flow, a steep descent on the lee slope, a thin boundary layer, a jump-like lift further downwind, and strong turbulence in the wake.
Part of an experimental outlook. Not a warning service.